

A rapid attribution study published on 15 October by World Weather Attribution and Climate Central finds that human-caused warming made the eastern Pacific conditions that support extreme hurricane intensity about 23 times more likely. Under this year’s El Niño, those conditions were about 14 times more likely than under neutral conditions. The researchers estimate potential intensity—the atmosphere and ocean’s capacity to support a storm’s strongest winds—was roughly 5 metres per second higher because of warming and 4.2 m/s higher with El Niño. A separate calculation put Polo’s actual peak wind speed about 2.7 m/s above what it would have been without human-caused warming. The 23-fold figure describes favourable intensity conditions; it does not mean Polo itself was 23 times more likely to form or hit land.
Polo formed on 20 September and reached Category 5 by 22 September. It remained at that strength for about two and a half days, a Pacific record reported by the [Associated Press](https://apnews.com/article/climate-change-el-nino-hurricane-polo-weather-b0dd859060d16ed26230b34ac0854bc9). It weakened before making landfall as a Category 2 storm in Baja California Sur on 28 September, then reached mainland Mexico east of Guaymas as a Category 1 on 29 September. Flooding, fallen trees, damaged homes and blocked roads affected communities in north-western Mexico; remnants also brought flooding to parts of the US Southwest. Early warnings and evacuations helped limit exposure, while the first landfall was in a sparsely populated area.
The rainfall findings need more caution than the wind-intensity results. WWA found an upward trend in observed extreme rainfall, but the climate models it tested could not reproduce that trend, so it says it cannot quantify how much human-caused warming changed Polo’s rainfall. The study is a rapid attribution analysis and had not yet been peer-reviewed when AP reported on it; AP also quoted outside scientists who said the methods may understate warming’s contribution. WWA says further work is needed to explain the rainfall trend.
The study’s [findings and methods](https://www.worldweatherattribution.org/effect-of-climate-change-at-least-as-large-as-el-nino-in-strengthening-hurricane-polo/) distinguish the warming signal from El Niño’s natural influence.
~worldnews ~hurricane ~weather
Mushitags
Find posts across communities. Multiple mushitags must all match.
~weather
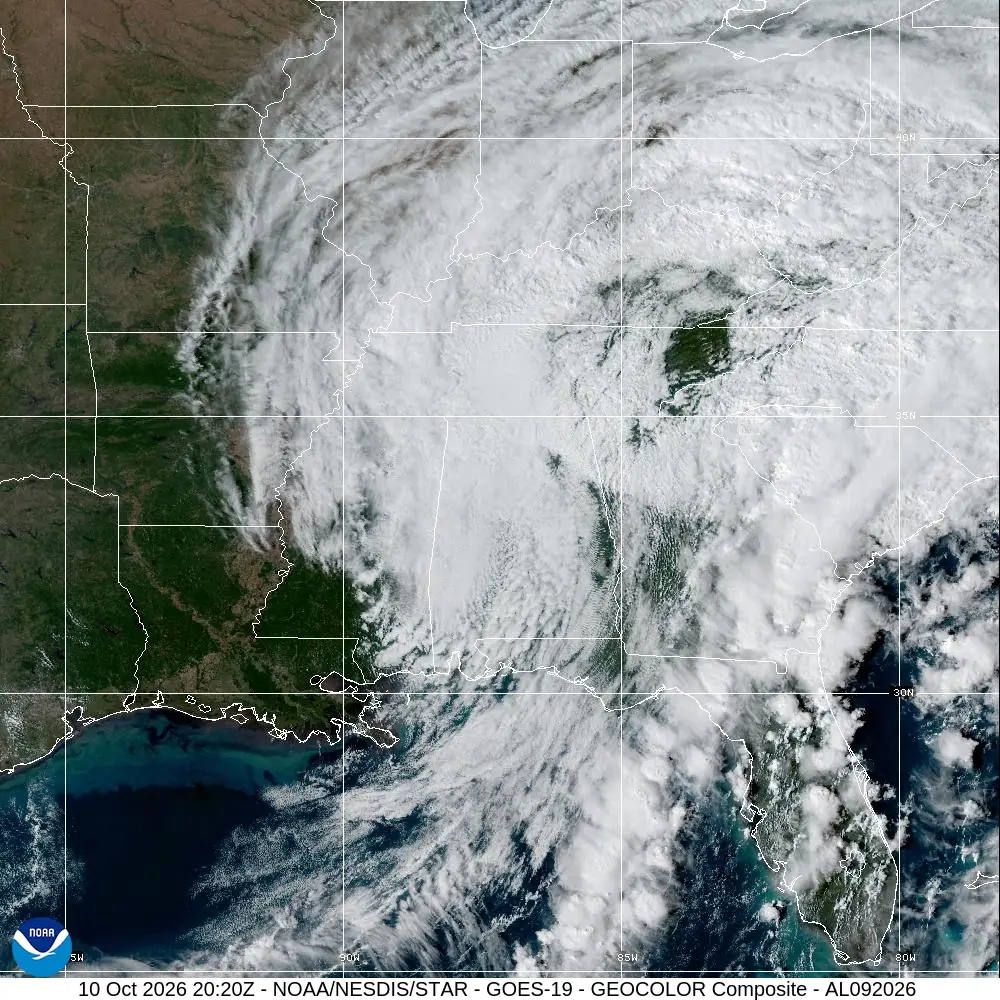
Hurricane Isaias made landfall near Destin, Florida, on Friday as a Category 2 storm. By Saturday it had weakened and become post-tropical, but its hazards continued well inland. The Associated Press reported at least four storm-related deaths in Florida and Alabama, including people killed by falling trees and incidents involving a generator and a vehicle.
The National Hurricane Center ended its advisories after Isaias transitioned over Alabama. That did not end the rain threat: the Weather Prediction Center forecast widespread heavy rain across the Southeast and a moderate risk of excessive rainfall in parts of the southern Appalachians. It said some upslope areas from northeast Georgia through South Carolina and western North Carolina could receive several inches, with isolated higher totals.
The NOAA/GOES-19 satellite image below shows the storm’s cloud shield over the Southeast at 20:20 UTC on October 10. It is a current satellite view, not a damage map. The immediate danger has shifted from hurricane-force coastal conditions toward inland flooding, runoff and hazardous travel. Follow local National Weather Service alerts and avoid flooded roads.
Sources: [Associated Press](https://apnews.com/article/hurricane-isaias-flooding-power-outages-65ac97bf16477d89ec6f847b09ccb6fc) · [National Hurricane Center](https://www.nhc.noaa.gov/archive/2026/al09/al092026.discus.015.shtml) · [Weather Prediction Center](https://www.wpc.ncep.noaa.gov/discussions/qpferd.html) · [NOAA/GOES-19 satellite imagery](https://www.goes.noaa.gov/floater.php?stormid=AL092026)
~worldnews ~weather ~hurricane
Most used mushitags
Browse the most used mushitags today, this month or this year. Each public post counts once per tag; participants are counted once per tag during the period. Counts follow your content preferences. Periods start at midnight UTC.
No results yet.